March Rent Survey Results
 Dear Members,
Multifamily NW collaborated with a broad group of housing professionals (management companies, private managers, housing authorities, nonprofits, and state agencies) to collect surveys of conventional and affordable rental housing to establish the ongoing impact on rent payment due to COVID -19 and legislation.
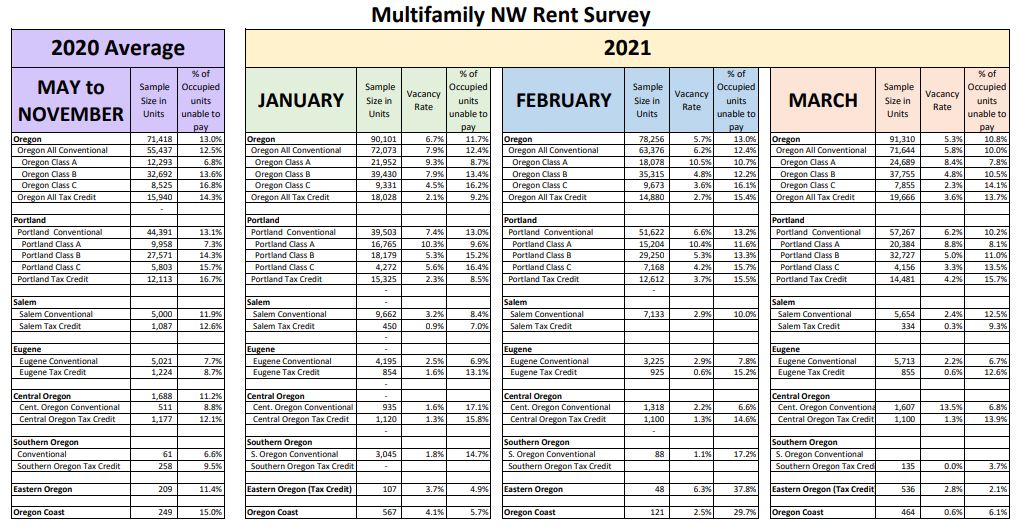
The numbers presented include a column of averages for 2020, as a basis for comparison. The 2020 numbers encompass seven months: May 2020 through November 2020. Click here or on the image above to view the data sets.
Key findings for March:
- On average, 10.8% of Oregon households did not pay their rent by the 15th of the month, which represents an improvement from 13% in February.
- Statewide, of renter households living in Affordable Tax Credit units, 13.7% were unable to pay rent, compared to the average of 15.4% the previous month.
- Conventional Class-C workforce multifamily housing experienced a 14.1% inability to pay rent, and only 2.3% vacancy. Although there was an improvement over the previous month, this remains the housing type and renters who are the most impacted by inability to pay. There continues to be a cause for concern that subsidy dollars, either through the Landlord Compensation Fund or other emergency rental assistance sources, are not reaching these residents who most need it.
- Class A market rate apartments have the highest vacancy rate, which is particularly acute in Portland, on top of a 7.8% inability to pay.
- Nine or Fewer Units - We received responses representing only 165 units from owners with nine or fewer units, compared to 403 last month. The smaller sample showed 24.7% inability to pay, compared to 25.5% last month. We believe these numbers do not reflect the industry actuals, and that both occupancy and collections are much healthier than these numbers. This is also the asset class best positioned to receive funding through the Landlord Compensation Fund.
Note on Methodology:
The survey asks “How many occupied households were unable to pay full rent by the 15th day of the month?” The survey then adjusts for vacancy to arrive at the true percentage of occupied households that are unable to pay their full rent.
Definitions
Real estate professionals often use categories (A, B, or C) to describe rental properties after considering a combination of factors such as age of the property, location of the property, growth prospects, appreciation, amenities, and rental income. There is no uniform or precise formula for establishing these categories.
Class A - These properties represent the highest quality buildings in their market and area. They are generally newer properties built within the last 15 years with top amenities and demand the highest rent with little or no deferred maintenance issues.
Class B - These properties are close to Class A designation being generally older and typically offer fewer amenities. Rent is typically lower than Class A
Class C - Class C properties are typically more than 20 years old and are not as well located. Due to a variety of factors, Class C buildings tend to have the lowest rent rates in the Conventional Housing market when compared to Class A and B properties
Conventional Housing – Market-rate housing with no household income limits, rent limits, or special programmatic requirements in the financing.
Affordable Housing – Government financed housing (Often using Tax Credits or Bonds) that impose initial household income limits and maximum rent limits, all predicated on affordability calculations based on the area median income.
We strive to collect the broadest possible sampling of data across the state of Oregon, but the response level can vary widely month to month. The March 2021 rent survey received 253 responses representing 91,310 units for an average portfolio size of 360 units, compared to 287 surveys in February representing 78,256 units and an average portfolio size of 272 units. This raises an interesting question: Is the overall improvement month-over-month an improvement of market conditions, or is it more reflective of a different sample based on the larger average portfolio size?
Thank you to every member and participant that took the time to complete the monthly Rent Surveys that created these important data sets.