April 2021 Monthly Rent Survey Results
Multifamily NW collaborated with a broad group of housing professionals (management companies, private managers, housing authorities, nonprofits, and state agencies) to collect surveys of conventional and affordable rental housing to establish the ongoing impact on rent payment due to COVID -19 and legislation. Click on the graphic below for higher resolution.
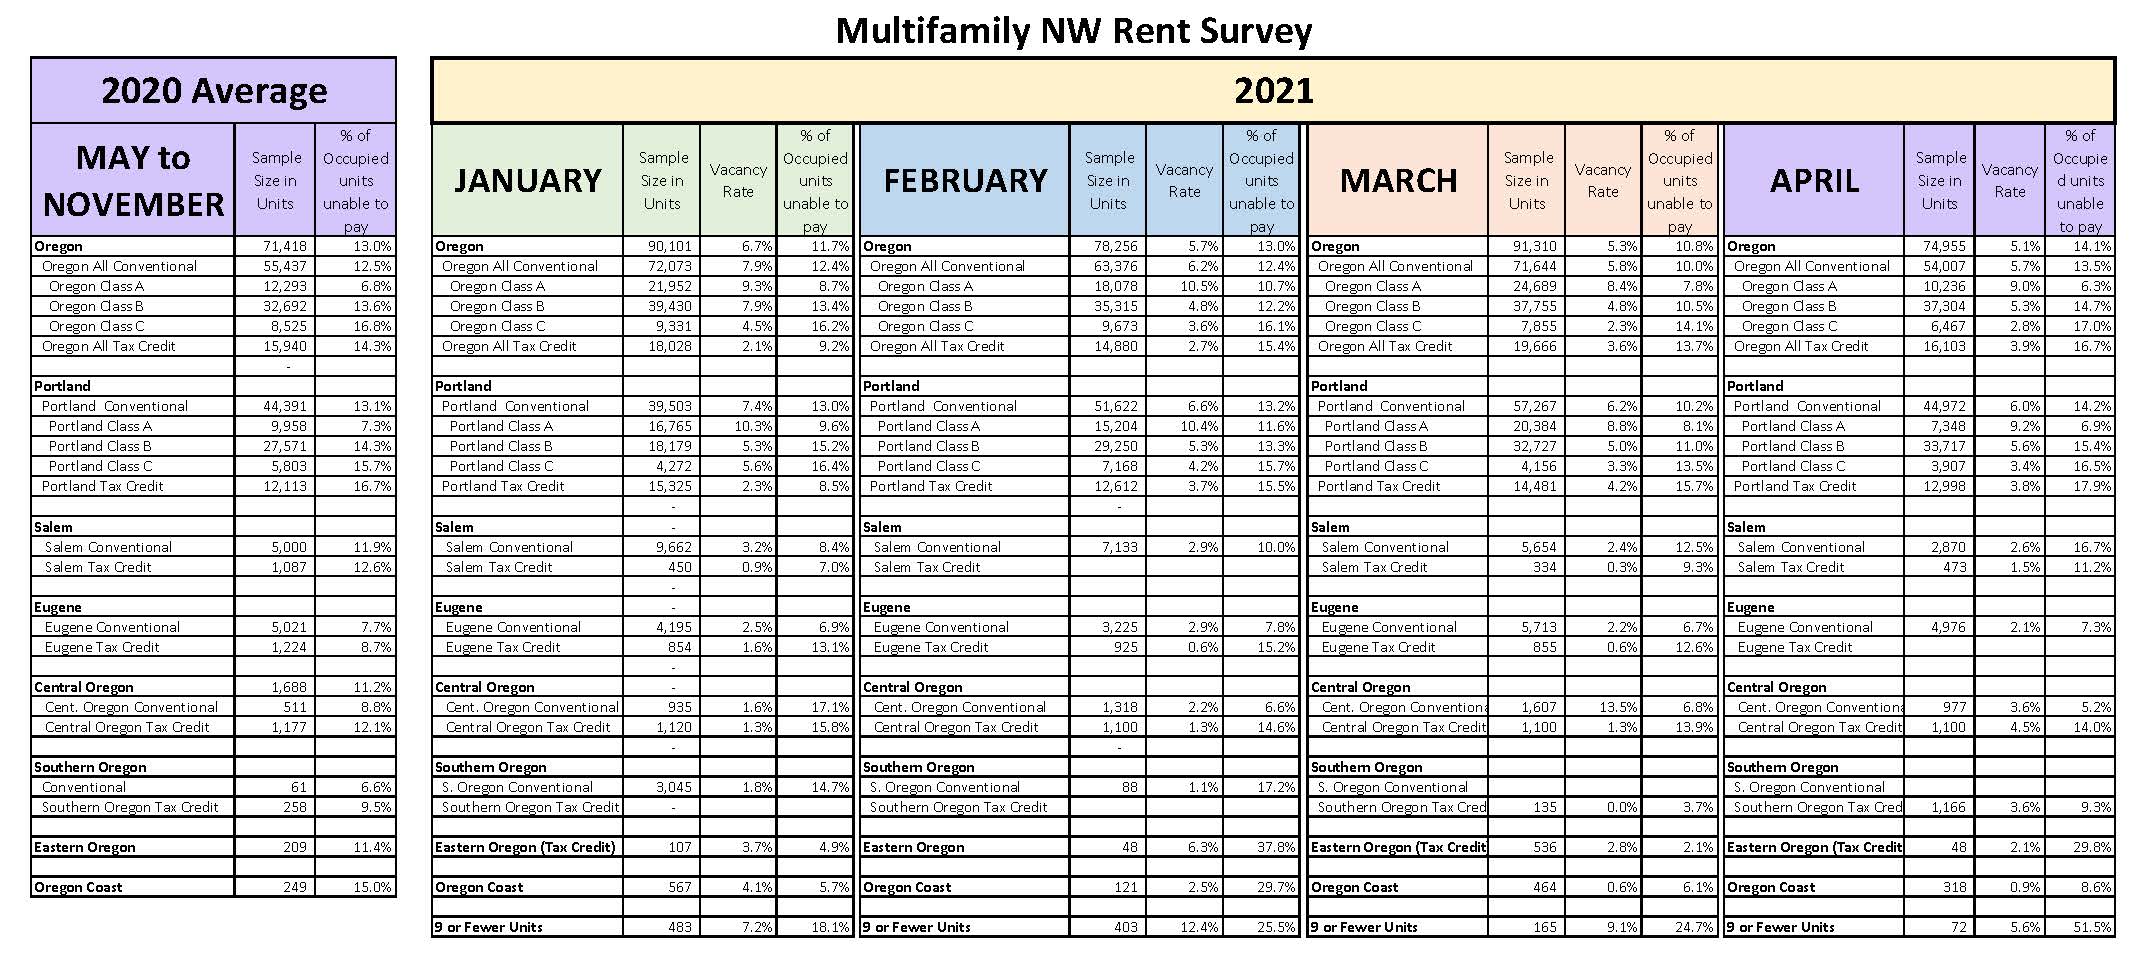
Key findings for April:
- Across Oregon, non-payment worsened dramatically in April. Some have suggested that the application process for the LCF is actually a significant contributing factor, as households are anticipating assistance, and have been strongly encouraged to execute “Declarations” which stop all collection efforts through June.
- On average, 14.1% of Oregon households did not pay their rent by the 15th of the month, which represents a significant decline from 10.8% in March.
- Statewide, of renter households living in Affordable Tax Credit units, 16.7% were unable to pay rent, compared to the average of 13.7% the previous month.
- Conventional Class-C workforce multifamily housing, experienced a striking 17% inability to pay rent, and only 2.8% vacancy. This remains the housing type and renters who are the most impacted by inability to pay.
- Class A market rate apartments have the highest vacancy rate at 9%, which is particularly acute in Portland. 3% of occupied units unable to pay in this asset type.
- Nine or Fewer Units - We received responses representing only 72 units from owners with nine or fewer units, compared to 165 last month. The smaller sample showed 51% inability to pay, compared to 24.7% last month. We believe these numbers do not reflect the industry actuals, and that both occupancy and collections are much healthier than these numbers. This is also the asset class best positioned to receive funding through the Landlord Compensation Fund.
- This month we added an additional question: “Since the beginning of the pandemic, how many tenants in your property or portfolio have vacated owing rent? How much rent did they leave owing?”
- 38 respondents completed this question, representing 12,938 total rental units.
- The respondents reported 426 moveouts that left owing a total of $1,130,664 in rent, or $2,593/move out.
- Although imprecise, applying this loss factor to the entire rental market yields in excess of $50 million in losses. Housing Providers are not eligible to recoup this lost revenue through the LCF or any rental assistance program.
Note on Methodology:
The survey asks, “How many occupied households were unable to pay full rent by the 15th day of the month?” The survey then adjusts for vacancy to arrive at the true percentage of occupied households that are unable to pay their full rent.
Definitions
Real estate professionals often use categories (A, B, or C) to describe rental properties after considering a combination of factors such as age of the property, location of the property, growth prospects, appreciation, amenities, and rental income. There is no uniform or precise formula for establishing these categories.
Class A - These properties represent the highest quality buildings in their market and area. They are generally newer properties built within the last 15 years with top amenities and demand the highest rent with little or no deferred maintenance issues.
Class B - These properties are close to Class A designation being generally older and typically offer fewer amenities. Rent is typically lower than Class A
Class C - Class C properties are typically more than 20 years old and are not as well located. Due to a variety of factors, Class C buildings tend to have the lowest rent rates in the Conventional Housing market when compared to Class A and B properties.
Conventional Housing – Market-rate housing with no household income limits, rent limits, or special programmatic requirements in the financing.
Affordable Housing – Government financed housing (Often using Tax Credits or Bonds) that impose initial household income limits and maximum rent limits, all predicated on affordability calculations based on the area median income.
2020 Numbers - The numbers presented include averages for 2020 as a basis for comparison. These numbers encompass seven months: May 2020 through November 2020.
Thank you to every member and participant that took the time to complete the monthly -Surveys that created these important data sets.